Financial Metrics to Track Growth
In the fast-paced world of running a dental practice, it's easy to get caught up in the day-to-day operations and patient care, often leaving little time to delve into the intricacies of financial metrics. However, understanding key performance indicators is crucial for ensuring your practice's long-term viability and profitability.
First, financial metrics provide an accurate picture of the practice's overall financial health. By analyzing metrics such as revenue, expenses, and profitability, practice owners can identify areas of strength and weakness, allowing them to make informed decisions to optimize their practice's financial performance.
Secondly, financial metrics offer valuable insights into the efficiency and effectiveness of various practice operations. For example, overhead costs, collections ratio, and production per hour can show how efficiently the practice utilizes its resources. Owners can pinpoint bottlenecks, streamline processes, and improve productivity to enhance practice performance.
Moreover, financial metrics empower owners to assess the effectiveness of their marketing efforts and patient acquisition strategies. By analyzing metrics such as new patient growth rate, case acceptance rate, and return on marketing investment, dentists can determine which marketing initiatives generate the best results and allocate resources accordingly.
We have conveniently attached a cheat sheet for your reference, containing essential financial metrics to assist you in analyzing and understanding key aspects of your financial data.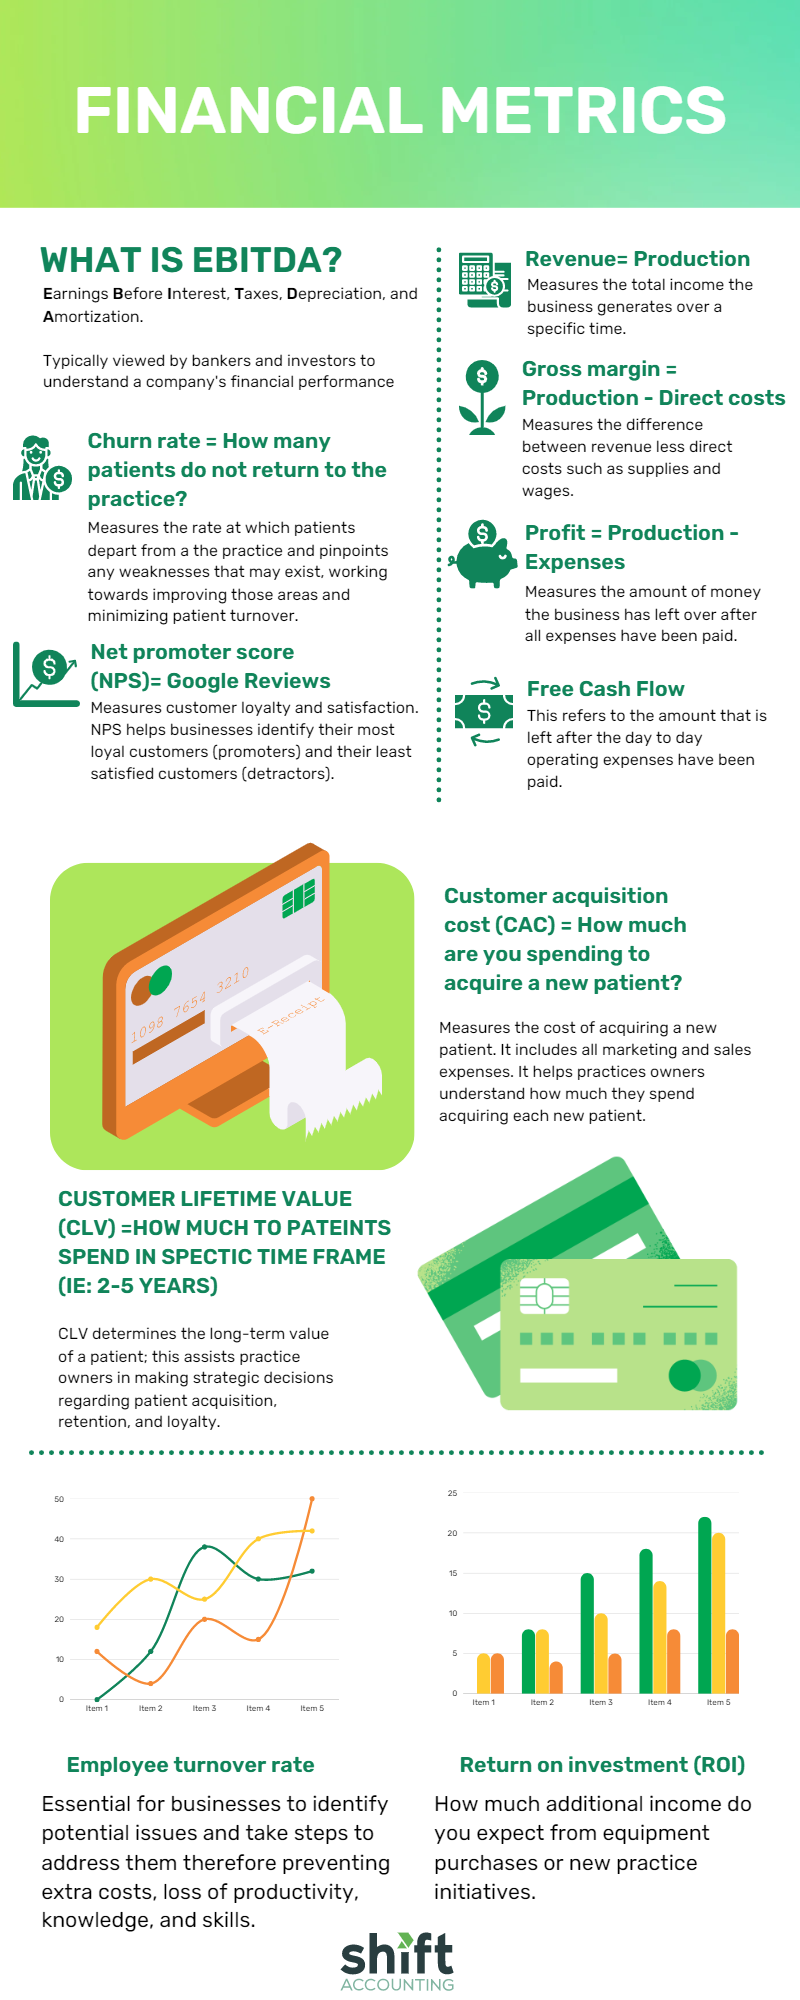
EBITDA
(Earnings Before Interest, Taxes, Depreciation, and Amortization) Although heavily debated, bankers, investors and DSOs look to this metric to understand a company's financial performance and identify areas where costs can be reduced, or revenue can be increased.
Other financial metrics that can be useful for analyzing a company's financial performance include the following:
1. Revenue= Production:
This metric measures the total income the business generates over a specific time.
2. Gross margin = production - direct costs, supplies and wages
This metric measures the difference between revenue and cost of goods sold (COGS).
3. Profit = Production - Expenses
This metric measures the amount of money the business has left over after all expenses have been paid.
4. Free cash flow = What amount is left after a business pays its daily operating expenses.
5. Customer acquisition cost (CAC) = How much are you spending to acquire a new patient?:
This metric measures the cost of acquiring a new customer. It includes all marketing and sales expenses. It helps business owners understand how much they spend acquiring each new customer or patient. By calculating CAC, businesses can make informed decisions about their marketing strategies, allocate their resources effectively, and identify areas for improvement to reduce costs and increase efficiency.
6. Customer lifetime value (CLV) =How much patients spend in a specific time frame (i.e., 2-5 years)
CLV determines the long-term value of a customer; this assists business owners in making strategic decisions regarding customer acquisition, retention, and loyalty. By calculating CLV, businesses can determine how much they should invest in acquiring and retaining customers, allocate resources effectively, and make data-driven decisions about marketing, sales, and customer service.
7. Churn rate = How many patients do not return to the practice?
This measures the rate at which customers stop doing business with them. By calculating the churn rate, companies can identify areas of weakness in their offerings, customer service, or overall experience and make data-driven decisions to improve these areas and reduce churn. Understanding churn rates can also help businesses predict future revenue and plan accordingly.
8. Net promoter score (NPS)= Google Reviews
This measures customer loyalty and satisfaction. NPS helps businesses identify their most loyal customers (promoters) and their least satisfied customers (detractors), which helps in making data-driven decisions to improve customer satisfaction and loyalty. It also allows businesses to benchmark themselves against their competitors and industry standards, identify areas for improvement, and remain competitive.
9. Return on investment (ROI) = How much additional income do you expect from large equipment (i.e., CBCT)
This metric measures the return on investment generated by a specific project or initiative. It helps measure the efficiency and profitability of an investment. By calculating ROI, businesses can evaluate the success of their investment strategies, allocate resources efficiently, and make informed decisions for future investments. It also helps companies to communicate their financial performance to stakeholders and build confidence and trust in the business.
10. Employee turnover rate:
Knowing the employee turnover rate is essential for businesses as it helps them identify potential issues and take steps to address them. A high employee turnover rate can be costly for companies, resulting in a loss of productivity, knowledge, and skills and creating a hostile workplace culture and reputation. By addressing issues contributing to turnover, businesses can improve employee engagement, offer more competitive compensation and benefits, provide better training and development opportunities, and create a more positive workplace culture. Reducing employee turnover can increase productivity and reduce recruitment and training costs.
In short, these metrics contribute to optimizing business processes, improving overall profitability, and making data-driven decisions to plan for the future.
If you're looking for help with your bookkeeping or building out cash flow projections, reach out. We'd be happy to chat.